Lesson 5 Starting with Data
teaching: 50
exercises: 30
adapted from: https://datacarpentry.org/r-socialsci/02-starting-with-data/index.html
questions:
- What is a data.frame?
- How can I read a complete csv file into R?
- How can I get basic summary information about my dataset?
objectives:
- Describe what a data frame is.
- Load external data from a .csv file into a data frame.
- Summarize the contents of a data frame.
keypoints:
- Use read_csv to read tabular data in R.
5.1 Presentation of the SAFI Data
SAFI (Studying African Farmer-Led Irrigation) is a study looking at farming and irrigation methods in Tanzania and Mozambique. The survey data was collected through interviews conducted between November 2016 and June 2017. For this lesson, we will be using a subset of the available data. For information about the full teaching dataset used in other lessons in this workshop, see the dataset description.
We will be using a subset of the cleaned version of the dataset that was produced through cleaning in OpenRefine. Each row holds information for a single interview respondent, and the columns represent:
| column_name | description |
|---|---|
| key_id | Added to provide a unique Id for each observation. (The InstanceID field does this as well but it is not as convenient to use) |
| village | Village name |
| interview_date | Date of interview |
| no_membrs | How many members in the household? |
| years_liv | How many years have you been living in this village or neighboring village? |
| respondent_wall_type | What type of walls does their house have (from list) |
| rooms | How many rooms in the main house are used for sleeping? |
| memb_assoc | Are you a member of an irrigation association? |
| affect_conflicts | Have you been affected by conflicts with other irrigators in the area? |
| liv_count | Number of livestock owned. |
| items_owned | Which of the following items are owned by the household? (list) |
| no_meals | How many meals do people in your household normally eat in a day? |
| months_lack_food | Indicate which months, In the last 12 months have you faced a situation when you did not have enough food to feed the household? |
| instanceID | Unique identifier for the form data submission |
You are going load the data in R’s memory using the function read_csv() from the readr package which is part of the tidyverse. So, before we can use the read_csv() function, we need to load the package. Also, if you recall, the missing data is encoded as “NULL” in the dataset. We’ll tell it to the function, so R will automatically convert all the “NULL” entries in the dataset into NA.
library(tidyverse)
interviews <- read_csv("data/SAFI_clean.csv", na = "NULL")
This statement creates a data frame but doesn’t show any data because, as you might recall, assignments don’t display anything. (Note, however, that read_csv may show informational text about the data frame that is created.) If we want to check that our data has been loaded, we can see the contents of the data frame by typing its name: interviews.
interviews
## Try also
## View(interviews)
## head(interviews)
## # A tibble: 131 x 14
## key_ID village interview_date no_membrs years_liv respondent_wall… rooms
## <dbl> <chr> <dttm> <dbl> <dbl> <chr> <dbl>
## 1 1 God 2016-11-17 00:00:00 3 4 muddaub 1
## 2 1 God 2016-11-17 00:00:00 7 9 muddaub 1
## 3 3 God 2016-11-17 00:00:00 10 15 burntbricks 1
## 4 4 God 2016-11-17 00:00:00 7 6 burntbricks 1
## 5 5 God 2016-11-17 00:00:00 7 40 burntbricks 1
## 6 6 God 2016-11-17 00:00:00 3 3 muddaub 1
## 7 7 God 2016-11-17 00:00:00 6 38 muddaub 1
## 8 8 Chirod… 2016-11-16 00:00:00 12 70 burntbricks 3
## 9 9 Chirod… 2016-11-16 00:00:00 8 6 burntbricks 1
## 10 10 Chirod… 2016-12-16 00:00:00 12 23 burntbricks 5
## # … with 121 more rows, and 7 more variables: memb_assoc <chr>,
## # affect_conflicts <chr>, liv_count <dbl>, items_owned <chr>, no_meals <dbl>,
## # months_lack_food <chr>, instanceID <chr>5.1 Note
read_csv()assumes that fields are delineated by commas, however, in several countries, the comma is used as a decimal separator and the semicolon (;) is used as a field delineator. If you want to read in this type of files in R, you can use theread_csv2function. It behaves exactly likeread_csvbut uses different parameters for the decimal and the field separators. If you are working with another format, they can be both specified by the user. Check out the help forread_csv()by typing?read_csvto learn more. There is also theread_tsv()for tab-separated data files, andread_delim()allows you to specify more details about the structure of your file. {: .callout}
5.2 What are data frames and tibbles?
Data frames are the de facto data structure for tabular data in R, and what we use for data processing, statistics, and plotting.
A data frame is the representation of data in the format of a table where the columns are vectors that all have the same length. Because columns are vectors, each column must contain a single type of data (e.g., characters, integers, factors). For example, here is a figure depicting a data frame comprising a numeric, a character, and a logical vector.
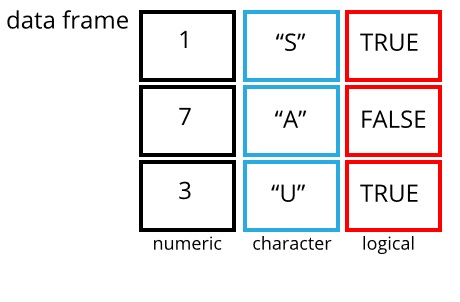
data frame example
A data frame can be created by hand, but most commonly they are generated by the functions read_csv() or read_table(); in other words, when importing spreadsheets from your hard drive (or the web).
A tibble is an extension of R data frames used by the tidyverse. When the data is read using read_csv(), it is stored in an object of class tbl_df, tbl, and data.frame. You can see the class of an object with
class(interviews)## [1] "spec_tbl_df" "tbl_df" "tbl" "data.frame"As a tibble, the type of data included in each column is listed in an abbreviated fashion below the column names. For instance, here key_ID is a column of integers (abbreviated <int>), village is a column of characters (<chr>) and the interview_date is a column in the “date and time” format (<dttm>).
5.3 Inspecting data frames
When calling a tbl_df object (like interviews here), there is already a lot of information about our data frame being displayed such as the number of rows, the number of columns, the names of the columns, and as we just saw the class of data stored in each column. However, there are functions to extract this information from data frames. Here is a non-exhaustive list of some of these functions. Let’s try them out!
- Size:
dim(interviews)- returns a vector with the number of rows in the first element, and the number of columns as the second element (the dim ensions of the object)nrow(interviews)- returns the number of rowsncol(interviews)- returns the number of columns- Content:
head(interviews)- shows the first 6 rowstail(interviews)- shows the last 6 rows- Names:
names(interviews)- returns the column names (synonym ofcolnames()fordata.frameobjects)- Summary:
str(interviews)- structure of the object and information about the class, length and content of each columnsummary(interviews)- summary statistics for each column
Note: most of these functions are “generic”, they can be used on other types of objects besides data frames.